• This indicator will display simultaneously pivot point levels and the percentage of ATR has been achieved by currency pairs you choose. As you know that the pivot points can be used to identify levels of support and resistance. Coupled with reached ATR percentage can increase the likelihood of a change of price movements, breakout or continuation.

    There are two types of pivot points that are used in this indicator, Standard and Fibonacci. Most traders know how its calculated, but I'll show it anyway.

    Pivot Point Calculation

    Standard Pivot Point:
    R3 = H + 2(PP – L)
    R2 = PP + (H – L)
    R1 = (2 x PP) – L
    PP = (H + L + C) / 3
    S1 = (2 x PP) – H
    S2 = PP – (H – L)
    S3 = Low – 2(H – PP)

    Fibonacci Pivot Point:
    PP = (H + L + C) / 3
    R3 = PP + ((H – L) x 1.000)
    R2 = PP + ((H – L) x .618)
    R1 = PP + ((H – L) x .382)
    S1 = PP – ((H – L) x .382)
    S2 = PP – ((H – L) x .618)
    S3 = PP – ((H – L) x 1.000)

    Abbr:
    C – Closing Price
    H – High
    L – Low
    PP – Pivot Point
    S1 – First Support
    S2 – Second Support
    S3 – Third Support
    R1 – First Resistance
    R2 – Second Resistance
    R3 – Third Resistance

    Indicator: Multi Pair Pivot Point Levels and ATR

    Parameters:
    • Symbol Sets, default value: EURUSD, GBPUSD, USDJPY, USDCHF, AUDUSD, USDCAD, NZDUSD, EURCHF, EURGBP, EURJPY, GBPJPY, GBPCHF. A list of pairs separated by comma.
    • Timeframe, default value: Daily.
    • Pivot Type, default value: Standard.
    • ATR Period, default value: 5.
    • Position - Top, default value: 0, top position of dashboard panel relative to chart frame container.
    • Position - Left, default value: 12, left position of dashboard panel relative to chart frame container.
    Appearance:


    Let's see what information we can get from the picture above. Visually we can see that the USDJPY on the weekly time frame has the following data:

    • Opening price is between PP and R1
    • The highest price this week is between R2 and R3
    • Lowest price this week is between PP and R1
    • Current price this week is between R1 and R2
    • ATR 4 weekly has been reached.
    Try to use symbol sets of EUR pairs (EURAUD, EURCAD, EURCHF, EURGBP, EURJPY, EURNZD, EURUSD). You can see the pair is being led or everything just like being locked up between R1 and S1, as shown below.


    Download Multi Pair Pivot Point Levels and ATR Indicator

    Go to download page.

    What Next

    In the future I would consider to make this indicator works like a multi-tab browser where we can see various kinds of information such as market profile data, moving averages such as SMA/EMA 200, 20 Days High-Low, etc.

    But for now, this is it, a Pivot Points and ATR Dashboard Indicator.
  • I decided to share the free version of Market Profile TPO Chart Indicator. It has all the functions available in the full version. It's just that this version will expire every Sunday. If you need it again, you can download the unexpired one from the free download page.

    UPDATE: The free version of this indicator is discontinued. But don't worry you can rent it 1 month for only $13 or 3 months for $26.
    Check it here.


  • On MT4 Scale fix serves to fix the current chart scale. If the scale has not been fixed, the chart will be automatically scaled vertically. This option disables automatic scaling and fixes the current scale. When this option is selected, the fields of additional scaling parameters "Fixed maximum" and "Fixed minimum" are activated.

    This script enables you activate or deactivate that functionality. Set a hotkey(eg. ALT+S) to this script to make it easier for you.

    Scale Fix - MT4 Script
    Scale Fix - MT4 Script

    Here it is, the Scale Fix Script :


    //+------------------------------------------------------------------+
    //| ToggleScaleFix.mq4 |
    //| http://www.fxindi.net |
    //+------------------------------------------------------------------+
    #property copyright "Copyright 2015, www.fxindi.net"
    #property link "http://www.fxindi.net"
    #property version "1.00"
    #property strict
    //+------------------------------------------------------------------+
    //| Script program start function |
    //+------------------------------------------------------------------+
    void OnStart()
    {
    //---
    long chartID = ChartID(), scaleFix;

    //--- receive the property value and do the toggle
    if(ChartGetInteger(chartID, CHART_SCALEFIX, 0, scaleFix))
    {
    //Print("Turned On/Off ScaleFix");
    ChartSetInteger(chartID, CHART_SCALEFIX, 0, !(bool) scaleFix);
    ChartRedraw(chartID);
    }

    }
    //+------------------------------------------------------------------+
  • This is Better Volume Indicator for MT4, an old stuff that has been updated to latest MT4 build. This indicator improves on your typical volume histogram by categorized the bars volume based on following criteria:
    1. Volume Climax Up: high volume, high range, up bars 
    2. Volume Climax Down: high volume, high range, down bars 
    3. High Volume Churn:  high volume, low range bars
    4. Climax Churn: both the above conditions (High Volume Churn and Volume Climax Up or Down or Volume Climax Down)
    5. Low Volume: low volume bars 
    6. Greater Than Prev 2 Bars: when there are no volume signals(1-5) and volume is greater than previous 2 bars volume
    7. Less Than Prev 2 Bars:  when there are no volume signals(1-5) and volume is less than previous 2 bars volume
    8. Neutral Volume: when there are no volume signals(1-7)
    Better Volume Indicator
    Better Volume Indicator

    This Better Volume indicator can send you popup alert, email alert and push alert/notification when volume climax, high volume churn and climax churn occurred. You only to turn it on from indicator inputs.

    Download Better Volume Indicator

    This indicator is free, you can directly download it from my Drive.
    Download
    Subscribe to receive updates
    Google Drive

  • A few days ago I posted Market Profile Indicator - Multiple Composite Profiles. Today I will show you a simple visual references that you can get from this indicator.

    On Friday there was a breakout against the upper limit of 3, 5 and a 10 days bracket of the composite profiles.

    Bracket Breakout
    Bracket Breakout
    Today We've got the following visual references:
    • 20 days bracket unchanged 
    • 10 days bracket expanding 
    • Two distributions at 3 and 5 days composite profiles, no bracket because there is more than one distributions on the composite profiles.
    Notice there is a jump on London open from the upper line of the lower distributions of 3 and 5 days composite profiles.
    Visual References
    New Visual References
    That is only a simple visual references. Sure we'll got a ton of it by extracting/analyzing raw data from the Export Refs Utility of this indicator. As we can see on the image below.

    Refferences - Raw Data
    Refferences - Raw Data

  • Today I want to share the Horizontal Grid Lines indicator for MT4 I created. With this indicator, you can adjust the size of the grid per chart periods as pips and pixel (Vertical Scale Fix require enabled).

    With settings like on the picture below, You will get a grid with a size of 5 pips during the period of your chart is M1, 10 pips during the period of your chart is M5, 20 pips during the period of your chart is M15, and so on.

    Horizontal Grid Lines Indicator for MT4
    Horizontal Grid Lines Indicator for MT4

    Next, you can try to activate the parameter "Enable Vertical Scale Fix" if you need it.

    Download Horizontal Grid Lines Indicator

    This indicator is free, you can directly download it from my Drive without adf.ly and without Drive Access Request.
    Download
    Subscribe to receive updates
    Google Drive

  • If you want to see the composite profiles of 3, 5, 10 and 20 days, then this indicator is suitable for you. You can set it to display only what you need, such as 10, 20 and 60 days or just one composite profiles of the last 5 days.

    This indicator is based on Donald L. Jones's book, "Value-Based Power Trading: Using the Overlay Demand Curve to Pinpoint Trends & Predict Market Turns". You may need to read it. The book is free, you can download it from his website(www.cisco-futures.com). There are also a lot of free stuff on his website that might be useful for you.

    How it looks like

    Market Profile - Multiple Composite Profiles
    Market Profile - Multiple Composite Profiles


    Indicator Inputs

    Market Profile - Composite Profiles Indicator Inputs
    Market Profile - Composite Profiles Indicator Inputs

    I will update this post or create a new post for details on using this indicator.

    Download

    This indicator is free, you can download it from my Google Drive. It may take some time for me to know your download request.
    Download
    Subscribe to receive updates
    Google Drive


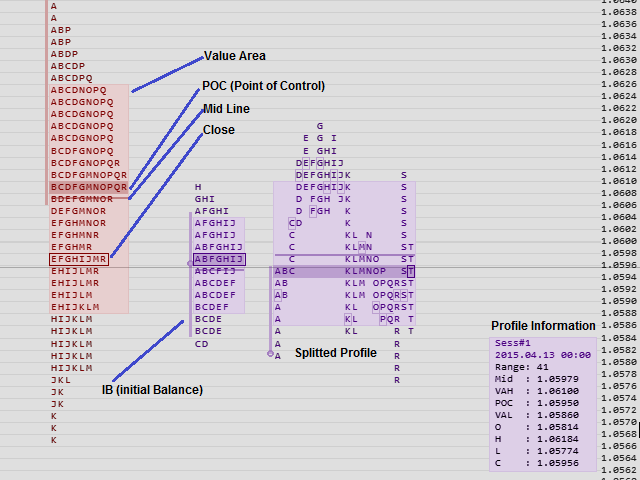
  • This is Market Profile Indicator for MetaTrader 4 which support up to 4 sessions on each day. In each profile you can see the market generated data such as IB (the Initial Balance), VA (Value Area), POC (Point of Controls), Single Print, Half Back (Mid Line). This indicator work on any chart periods that less than 4 hours (H4).

    You can choose whether to display 1 , 2 , 3 or 4 sessions by enabling or disabling the session number from indicator parameters.

    Market Profile Indicator - Multi Sessions
    Market Profile Indicator - Multi Sessions


    Video Tutorials

    Get this indicator on MQL5 Market Place

    Buy Market Profile Multi Sessions customer indicator in the store selling algo trading systems
  • This Market Profile Indicator is for Metatrader 4 which support the creation of Monthly, Weekly, Daily, and 4 Hours profile. These are some of features of this indicator:
    • User Friendly Panel
    • Profile Merge
    • Profile Split
    • Profile view as letters or histogram

    White Scheme Market Profile - TPO Chart

    Black Scheme Market Profile - TPO Chart

    Video of Market Profile - TPO Chart

    Buy Market Profile Indicator - TPO Chart on MQL5 Market Place

    Buy TPO Chart customer indicator in the store selling algo trading systems

    Get the Free Version

    Go to this post: Market Profile Indicator - TPO Chart XP